
Access the complete guide: route, gearing, training tips and race strategy
EDT 2026 – Time estimates (by deciles) + quick calculation from your 2025 ranking
Want to know where you really stand for L’Étape du Tour 2026?
This page is based on two solid references: EDT 2025 deciles and La Marmotte 2025 deciles.
Working assumption
EDT 2026 time ≈ Marmotte 2025 time
2026 average speed calculated over 170 km
Table – EDT 2025 vs EDT 2026 estimate (Marmotte 2025 time)
| Marker | EDT 2025 rank | EDT 2025 time | Marmotte 2025 rank | Marmotte 2025 time | EDT 2026 estimate | Extra time (2026 – 2025) | Avg speed EDT 2026 (170 km) |
|---|
- The “EDT 2026 estimate” column uses Marmotte 2025 times.
- 2026 speed is recalculated over 170 km (EDT 2026), not Marmotte distance.
Quick calculation (1 field)
Estimated EDT 2026 time
—
—
Average speed 2026
—
calculated over 170 km
This calculation is intentionally simple: it places your rank within the 2025 distribution and applies the 2026 correspondence (Marmotte 2025 time).
Want to go further (watts, gearing, cadence)? → that’s the next page.
VELO-PERSO.COM OPINION
Time & ranking projection: a useful benchmark, not an exact science
A time estimate does not predict your exact finishing position. Among the top 100 riders, gaps can be significant, while in the middle of the peloton it is common to see 100 riders pass within a few dozen seconds.
What this means: this projection helps the fastest riders define a realistic target time — and catch the right groups in the valleys. For most of the field, the key takeaway is that, at comparable fitness, it is realistic to expect up to 2 extra hours on the bike.
This is exactly where this benchmark becomes meaningful: it allows you to prepare with full awareness. A few well-placed adjustments — one extra 5-hour solo ride, a one-week altitude camp in late May, 1 kg less thanks to proper tapering, the right gearing choice, disciplined management of your power zones, and accurate hydration and fueling at the right moments — can help you gain hundreds of places, sometimes more than 1,000 when combined.
METHOD USED
Why Marmotte times can be used to estimate EDT 2026
Here, the 2026 projection is built from Marmotte finishing times (a “high-mountain” reference). This approach is consistent for two simple reasons:
L’Étape du Tour and La Marmotte attract riders with comparable profiles: well-trained amateurs able to sustain long mountain efforts. La Marmotte tends to be slightly more mountain-oriented (more pure climbers), but the overall performance distribution remains close enough to produce useful benchmarks (deciles).
The EDT 2026 course is not strictly identical (sequence of climbs, effort distribution, rolling sections…), but our topographic analysis using IGN maps shows only a 3 m difference in total elevation gain between the two routes. On a day with more than 5,000 m of climbing, this difference is negligible: the times can reasonably be reused as a projection baseline.
Key takeaway
EDT 2026: estimated real elevation gain ≈ 5,100 m
Weather: the variable that can shift finishing times
- Heatwave: major impact (especially in the Col de Sarenne) → times increase.
- Rain: slows the entire course → times noticeably increase.
FAQ
Étape du Tour 2026: time estimate & comparison vs 2025
These answers are designed to keep things simple and practical. Priority question: how much extra time to expect in 2026 vs 2025.
#1 How much extra time should I expect for Étape du Tour 2026 versus 2025?
Bottom line: plan your day assuming it will be noticeably longer than 2025 — and prepare accordingly.
#2 Why is Étape du Tour 2026 longer than 2025?
- a long distance (170 km),
- an estimated real elevation gain of ~5,100 m,
- and difficulty concentrated in high mountains.
#3 What does the “extra time” column in the table mean?
- your position within the EDT 2025 deciles,
- and La Marmotte 2025 times used as a high-mountain reference.
#4 Why use Marmotte times to estimate EDT 2026?
- a rider profile very similar to Étape du Tour,
- and a nearly identical total elevation gain (measured difference ≈ 3 m).
#5 If I rode 8h15 at EDT 2025, what should I target in 2026?
#6 Does this simulator predict my exact finishing rank?
#7 Can I reduce the time gap between 2025 and 2026?
- one extra long solo ride (5h),
- a one-week mountain camp,
- 1 kg less thanks to a proper taper,
- appropriate gearing,
- clean management of power zones,
- solid fueling and hydration.
#8 Can weather significantly change my finishing time?
- Heatwave: a major impact, especially in the Col de Sarenne → times increase.
- Rain: slows the whole course and increases fatigue → times noticeably increase.
#9 From what level does the risk of missing cut-offs increase in 2026?
#10 Is this simulator enough to prepare for EDT 2026?
Key takeaway
Expect ~+1h30 to +2h vs 2025 for most riders — and plan your pacing, fueling and gearing accordingly.
Olivier from velo-perso.com
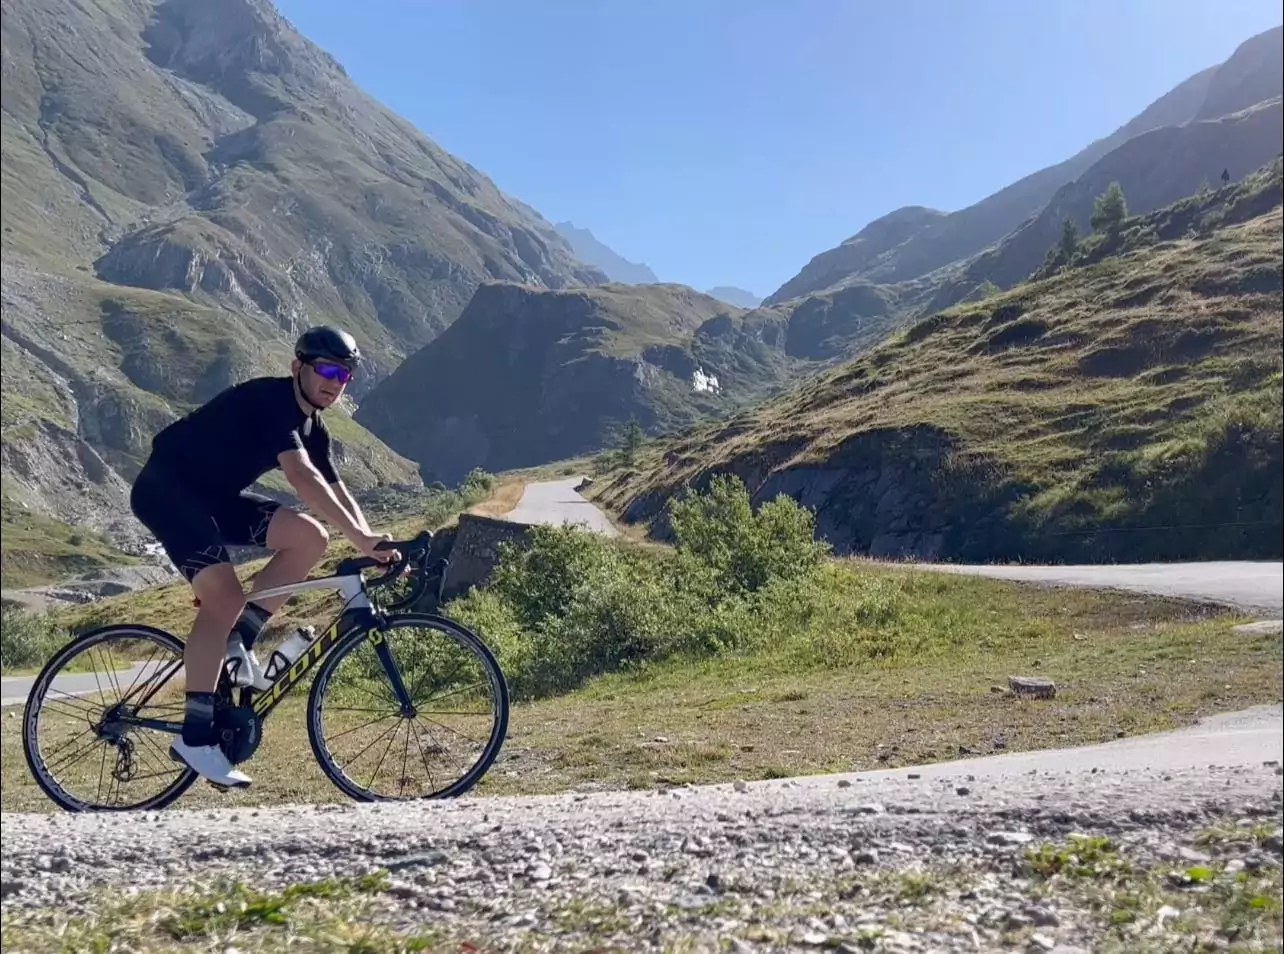
Behind these tips is my journey as a competitor (former Elite N1 and pro trainee) and a deep passion for the technical side of cycling. I've known the podiums, but I've also experienced the failure of finishing 600th at the Étape du Tour due to major strategic mistakes. Since 2012, I’ve used power meters to decode the physics of performance. My goal? To share this experience so that every ride—from the Galibier to the Rockies—remains a pleasure above all.
"Take it step by step, but stay ambitious!"